Model Objective
This model allows you to track all of the organization's projects with a clear, concise vision adapted to governance bodies (management, steering committee, PMO).
It was designed to meet the following needs:
- Quickly visualize the status of the project portfolio
- Identify projects in difficulty
- Track committed budgets
- Prioritize actions to be taken
- Highlight major risks
- Understand the evolution trend of each project
The template is based on a simple and readable structure, suitable for a strategic suivi.
Create a Board from the template
- In the workspace of your choice, click on "Add a new board".
- Access the PILOTAGE section and search for the "Project Management" template.
- To discover the template's features, start by importing the test data. This will allow you to visualize a concrete example and quickly familiarize yourself with the structure.
Once ready, you can switch to a blank template to create your own customized board.
[GIF to insert]
Data Structure
Each row in the board represents a project.
The model includes the following information:
- Managers (sponsor and project director)
- Overall project status
- Progress (in %)
- Project Period (start and expected end dates)
- Budgets (planned / spent)
- Main Risk and Criticality
- Evolution trend
This data enables quick decision-making and helps prioritize actions.
Views included in the template
The template contains several complementary views designed to facilitate portfolio reading and analysis.
1. Data table
Description:
Raw view containing all board columns.
Usage:
- View complete information details
- Perform ad hoc searches
- Export or import data
This view serves as a reference support but is not intended for committees.
2. Strategic Summary
Description:
Synthetic table view providing an overview of the project portfolio.
Usage:
- Quick status overview
- Progress analysis
- Budget visualization
- Preparation of steering committees
This is the most suitable view for an overall presentation.
3. Suivi by overall status (Kanban)
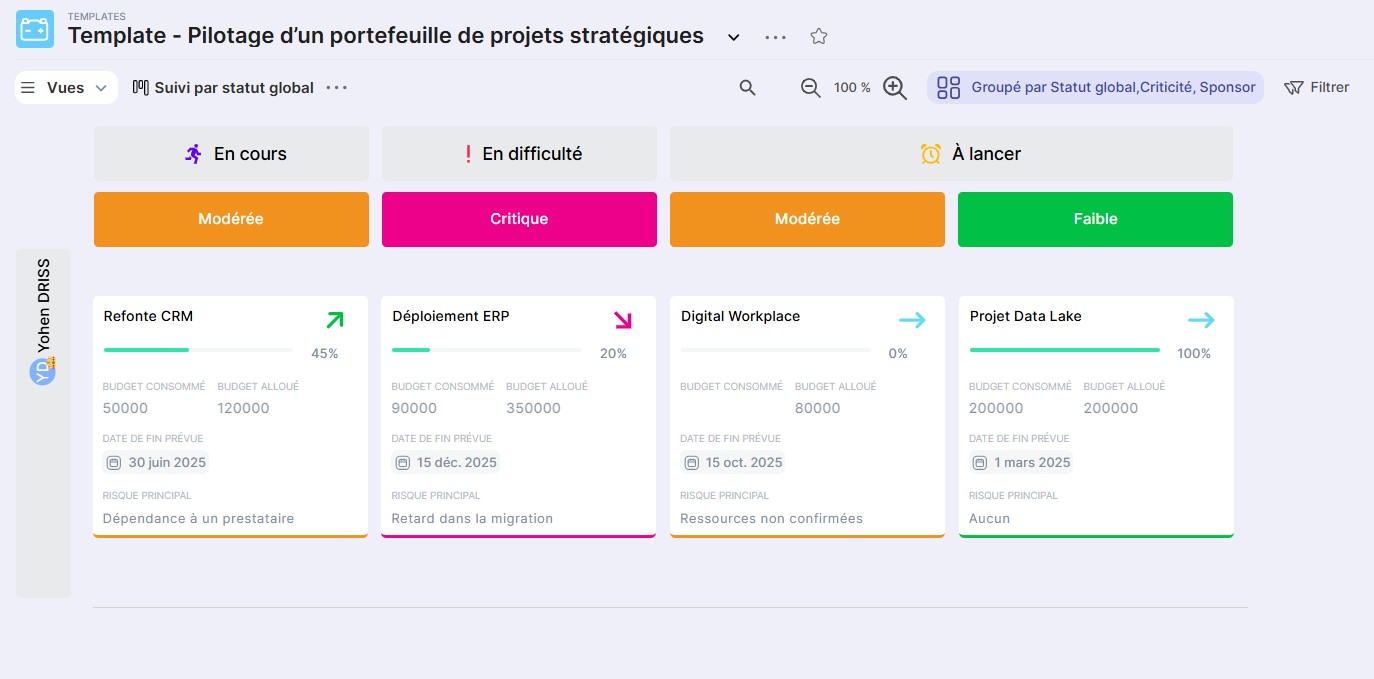
Description:
Kanban view allowing you to visualize projects grouped by status.
Usage:
- Immediately identify projects in difficulty
- Identify sensitive projects (via criticality)
- Observe the distribution of projects by sponsor
Ideal for collaborative analysis in meetings.
4. Project Timeline
Description:
Chronological view showing the duration of each project.
Usage:
- Verify the sequencing of projects
- Identify significant overlaps
- Detect risks of overload or impossible scheduling
This view is useful for anticipating calendar impacts.
5. Projects at Risk
Description:
Filtered view highlighting only sensitive projects.
Usage:
- Focus attention on projects requiring immediate action
- Prepare alert points before committees
- Track the evolution of risks over time
Essential view for effective governance.
6. Dashboard
(Available if the feature is enabled)
Description:
Synthetic view grouping several key indicators of the project portfolio.
Usage:
- Presentation to the executive committee
- Monthly or quarterly analysis
- Suivi of indicators: number of projects, distribution by status, budgets, criticality…