Configure and use the State Matrix view in Suivi, based on a concrete example (competitor benchmark / battle cards), and present its limitations and best practices.
General principle of the State Matrix view
The State Matrix view is not a standalone view: it crosses two "child" Kanban-type views from two different boards.
Board 1 = "parent" board, the State Matrix view displays cards in grid form. Board 2 = first axis of the matrix (rows or columns) Board 3 = second axis of the matrix (rows or columns)
Essential Prerequisites
- Three different boards
- Kanban views are shared
- Boards are in the same workspace
Detailed Use Case
Competitor Benchmark
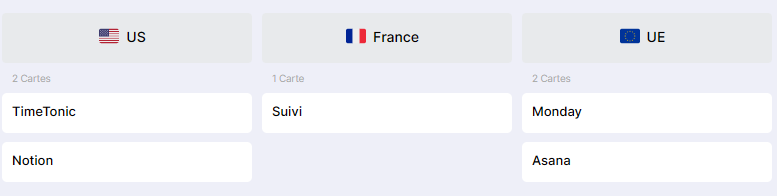
- A competitors board (TimeTonic, Asana, Monday, …)
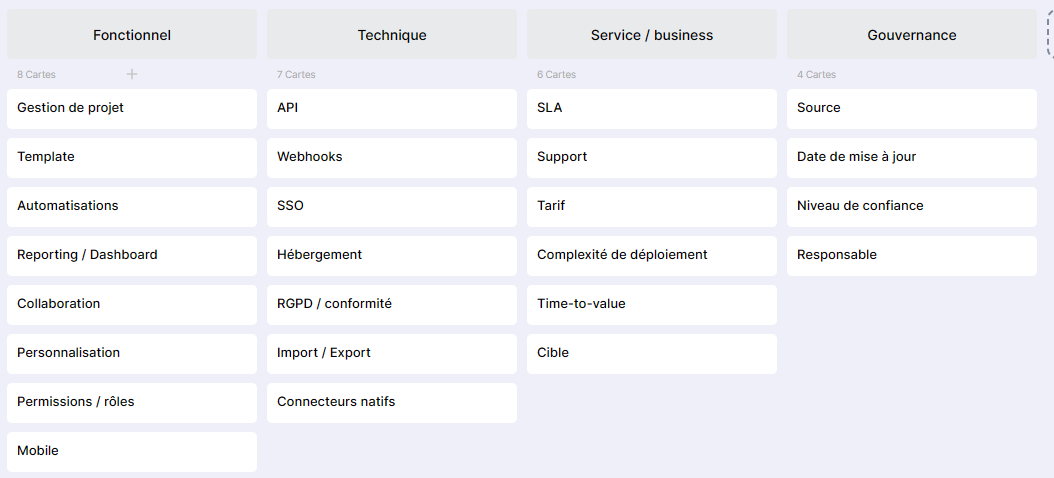
- A features board (categorized: project management, integration environment, pricing…)
- A benchmark board.
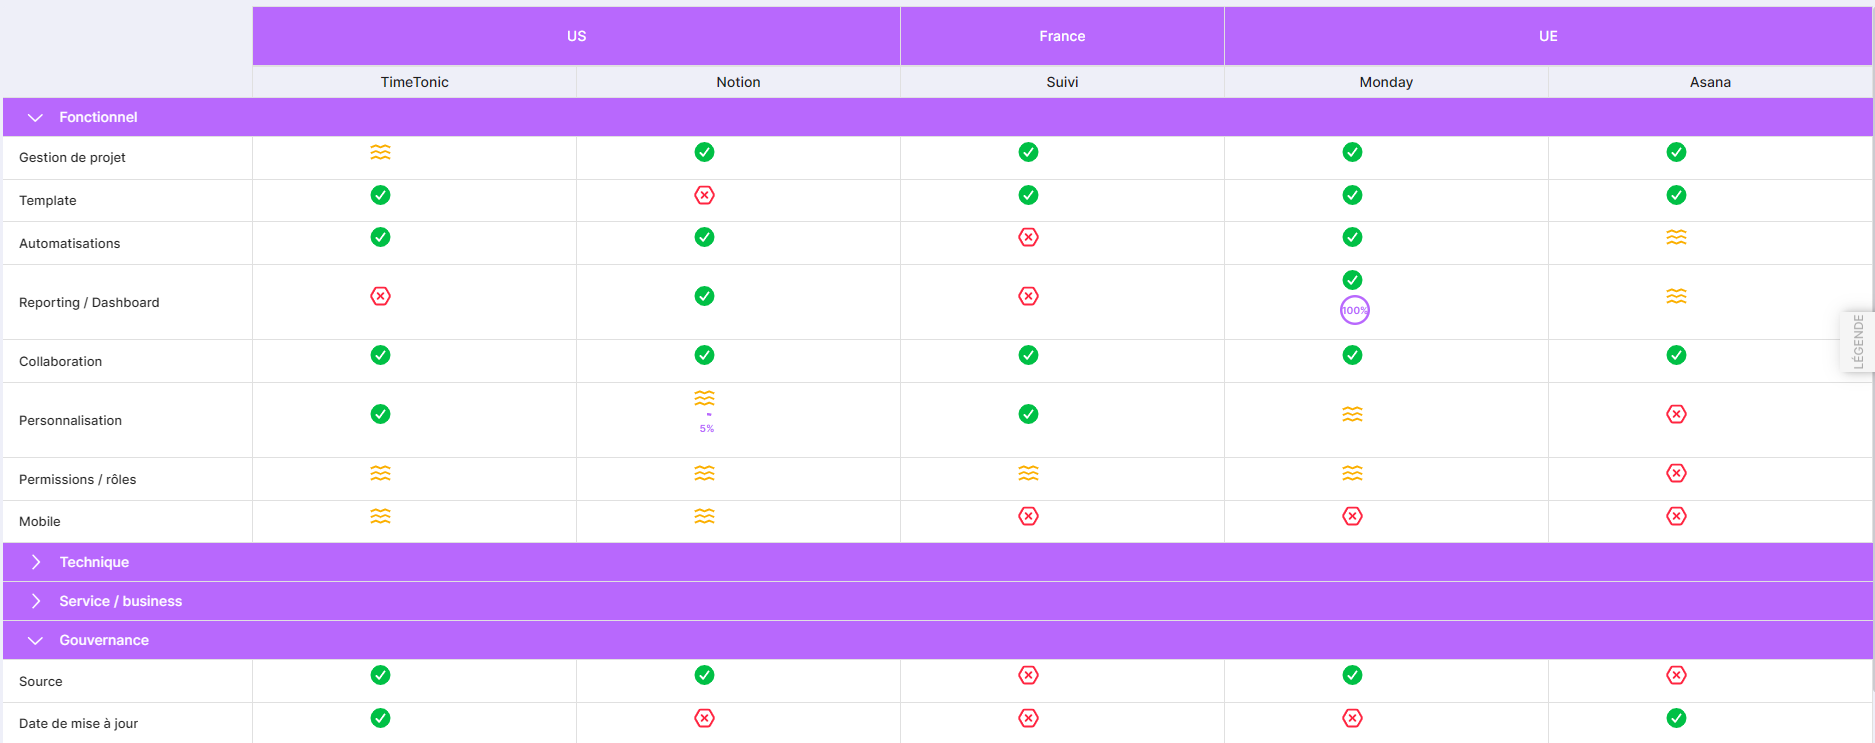
Visual Results
Status Matrix View (Benchmark)
Concurrent View (child)
Feature View (child)
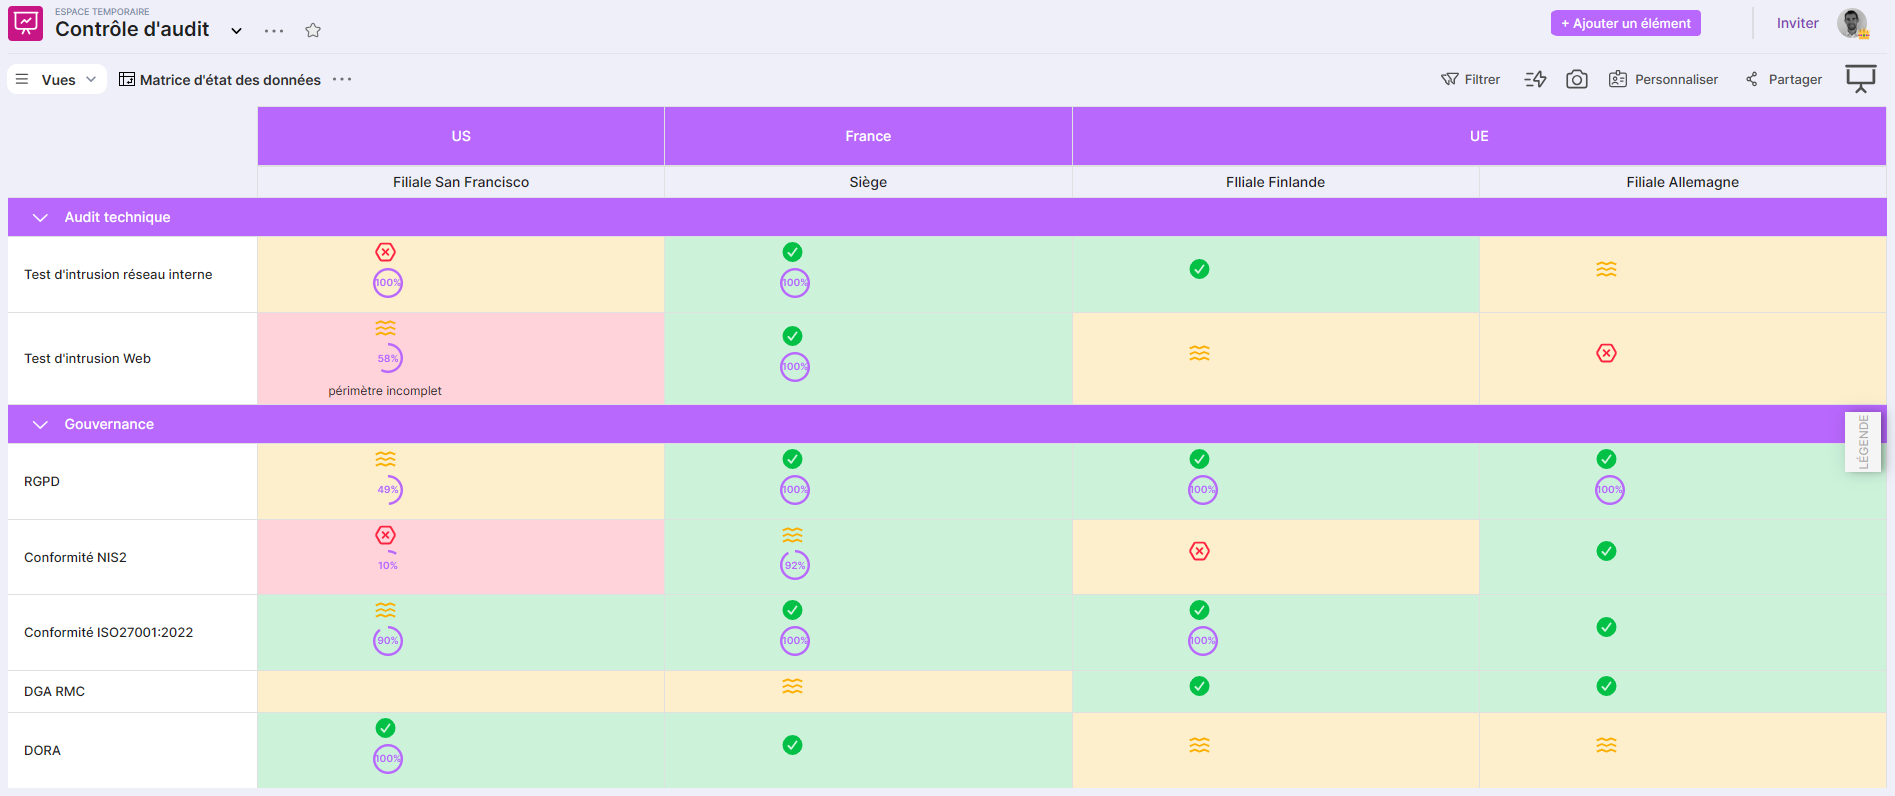
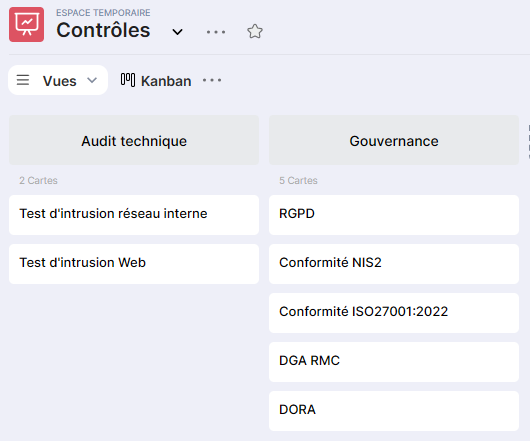
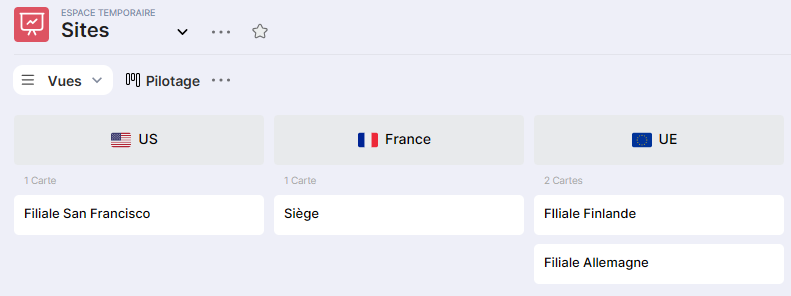
CISO - Subsidiary Audit Control
- A controls board: list of controls performed (Technical audits, governance, etc.)
- A sites board: list of subsidiaries
- A subsidiary audit control board.
Visual Results
Status Matrix View (Subsidiary Audit Control)
Controls View
Sites View
Quick Start
Board Solution Benchmark → Status Matrix Board Competitors → List of competitors in a Kanban view Board Features → List of features in a Kanban view
Step 1 - Create the child views
The objective is to create Kanban views (or use an existing one) and share them.
- Make a list of competitors/features
- Add a "Choice from a list" type attribute to enable grouping
- Create a Kanban view
- Share the view
Board 1: Competitors
Board 2: Features
These shared Kanban views are then selected as axes (rows/columns) of the matrix.
Step 2 – Create and configure the status matrix view
In the table view (default):
- Fill in the relationships (relation-type attributes for competitors and features)
- Add the attributes
- Description: Text
- Badge: Icon
- State color: Color
- Progress: Progress
Adding and configuring the State Matrix view
Columns: select the Kanban view of the Competitors Board. Rows: select the Kanban features Kanban view of the Features Board.
Step 3 – Populate the matrix (manually or via CSV import)
Manual filling +
Choose a Tag (e.g., Value = Yes). Click on the relevant cells to quickly apply this Tag.
Filling by CSV Import
- Export the existing board as CSV or Excel.
- Work on the export to obtain a structure "one row = one intersection (Competitor, Feature)" with the corresponding columns: Competitor, Feature, Value, Color, Label, …
- Re-import this CSV into the Battle cards board (Table view). Verify that the Competitor and Feature values match exactly the Tags/values from the parent boards (so that the links work).
Anatomy of a Status Matrix Cell
Each cell in the matrix corresponds to a card from the "child" board (Board 3). This card can display up to 4 types of information:
- Title (Plain text) Ex: brief comment, mini summary, additional label. Limitations: plain text only, no rich text (no bold, no formatting).
- Badge (Tag / icon) A Tag field (with icon and/or color) used as a badge. Ex: ✅ OK, ❌ KO, ⚠️ Partial, or business color code.
- State color Tag field dedicated to the background/state color (independent of the badge).
- Progress value Numeric/slider field to display progress (0–100%). Displayed as a circle or simplified gauge in the cell.
Functional limitations to know
Only one card per intersection
For a given pair (A, B) (e.g., Competitor X, Feature Y), there can only be one card in the matrix board. If multiple cards exist with the same pair (A, B), the Matrix displays only one, and the user doesn't know which one (probably the first in internal ID order).
No Dynamic Filtering in the Matrix
In the Status Matrix view, you cannot filter directly to display only a subset (e.g., 1 single competitor, 1 single feature category). Filtering must be configured in the source Kanban views (Board 1 and Board 2):
e.g., create a "Europe Competitors" Kanban view and a "Core Features" view, then use them in the matrix.
Limited display in each cell
The cell cannot display "all" the card content. It is limited to: Title, Badge, Color, Progress (4 elements). It is not possible to display multiple distinct tags at the same time if only one Tag field is configured as Badge.
Best practices & recommendations
First model the 3 boards + fields + Kanban views, then integrate the data. Avoid text fields for axes (Tag: essential for Kanban grouping).
One intersection = one row → avoid invisible duplicates in the matrix. Limit the number of properties displayed in each cell
In the Matrix configuration, choose which form opens when clicking on a cell. Create a specific "Battle card" form that only displays the fields useful for users (or even a "read-only" form).