A template to manage your projects at a glance (weather, trend, progress, milestones, schedule).
·
2 min read
Template — Project Weather
The Project Weather template is used to manage a project portfolio in a simple and visual way: where each project stands, whether it's improving or deteriorating, what the progress level is, and what the upcoming milestones are.
What is this template for?
Get an overview of all your projects (weekly review / steering committee / portfolio committee).
Quickly visualize the weather (risks / pain points) and the trend (whether it's improving or not).
Track maturity, progress, the schedule, and key milestones.
Prioritize topics (priority) and clarify who is responsible.
What the template contains
A "projects" database with 5 ready-to-use views:
Portfolio 📚 (cards)
Project List (table)
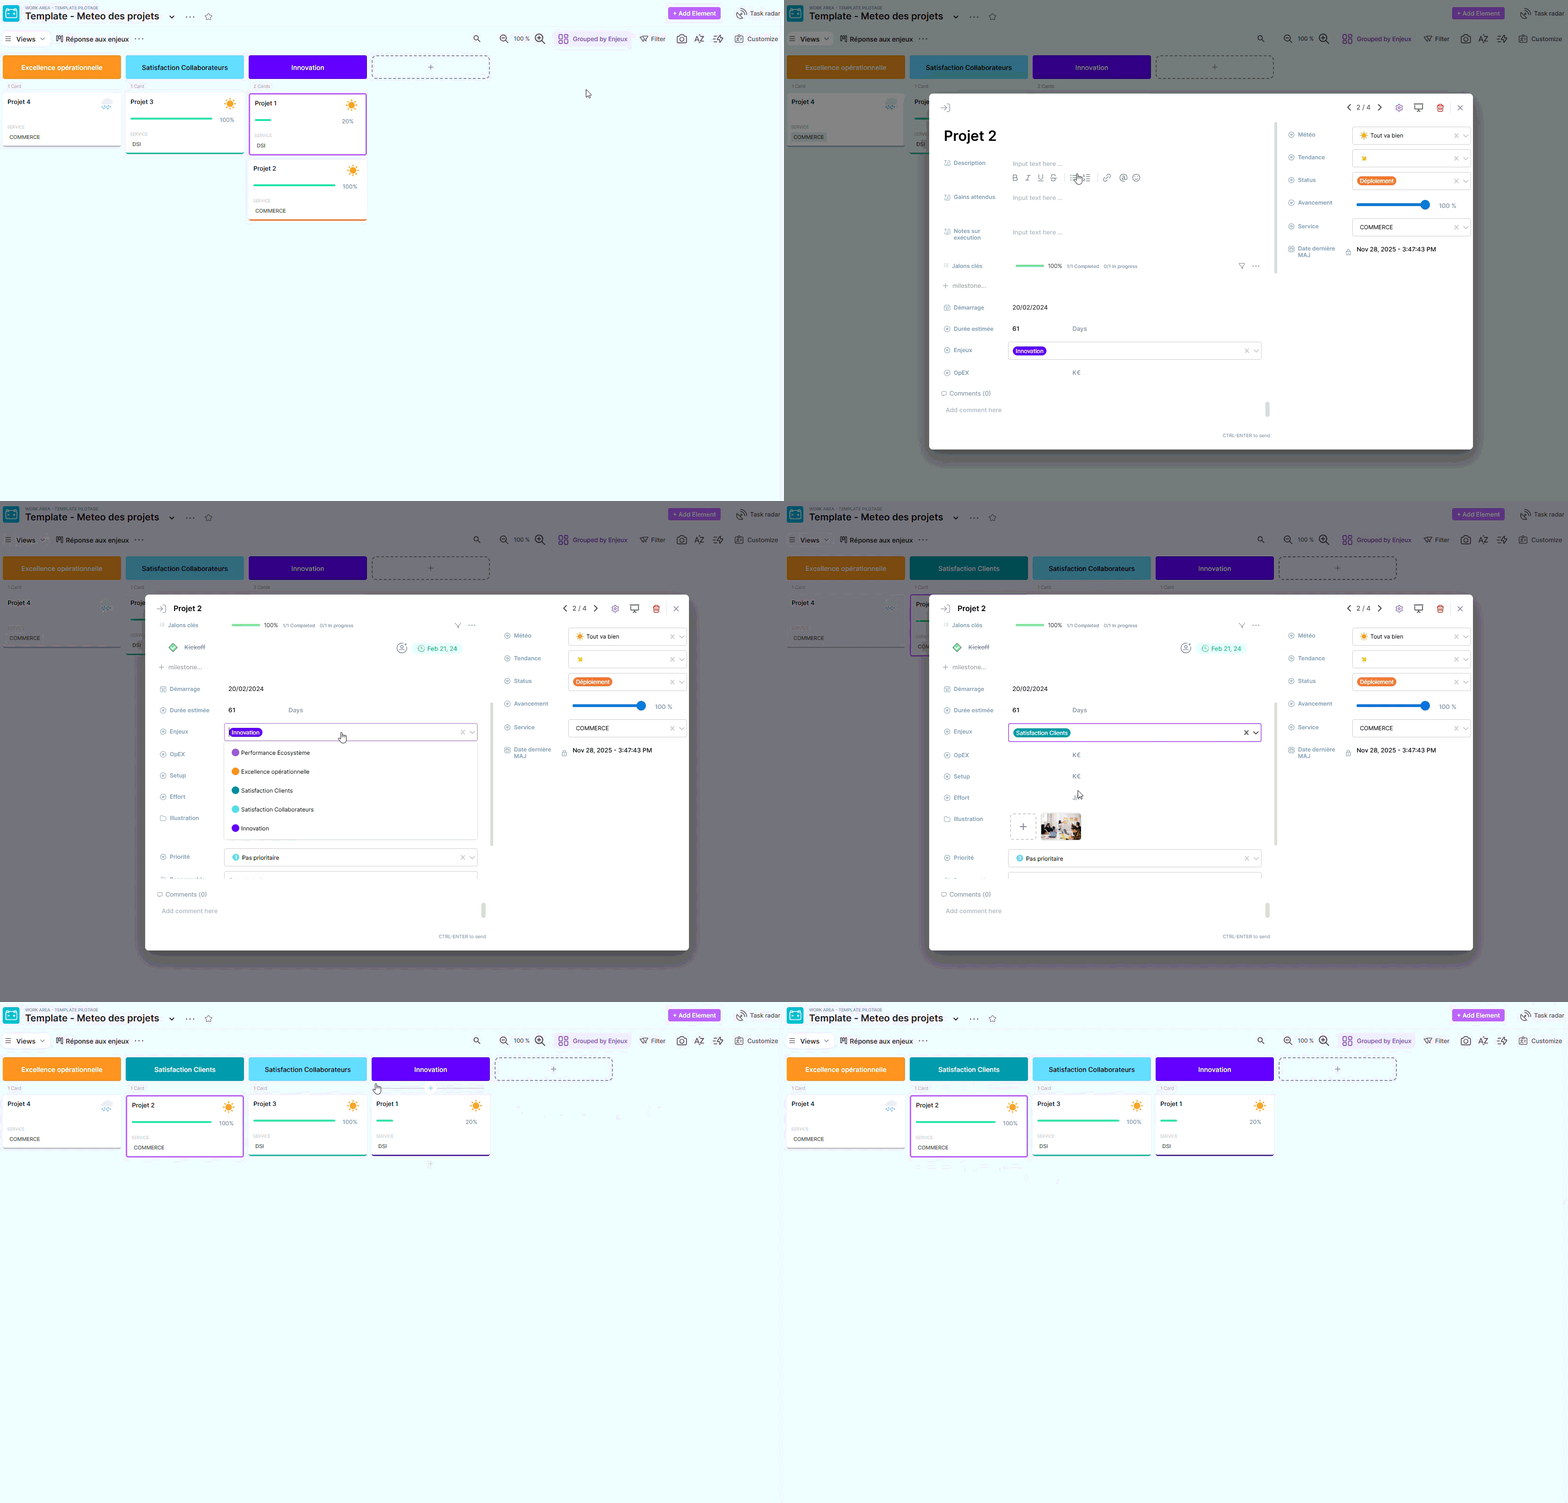
Response to Challenges (cards)
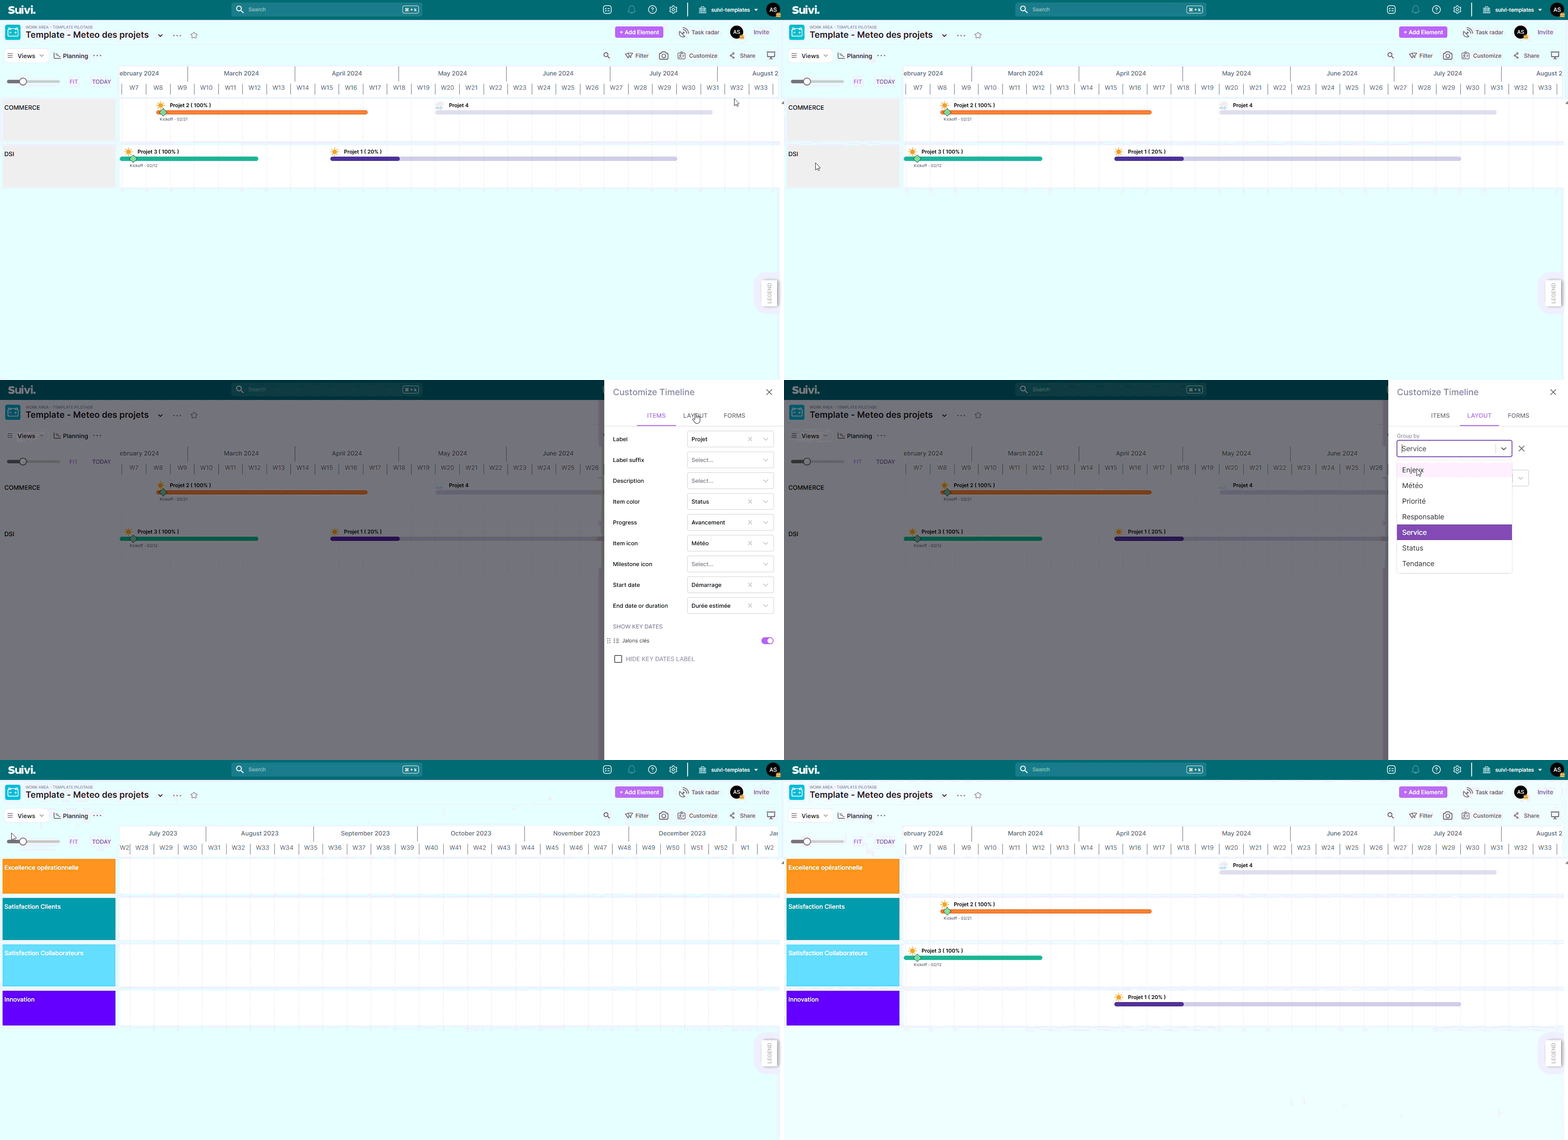
Planning (planning)
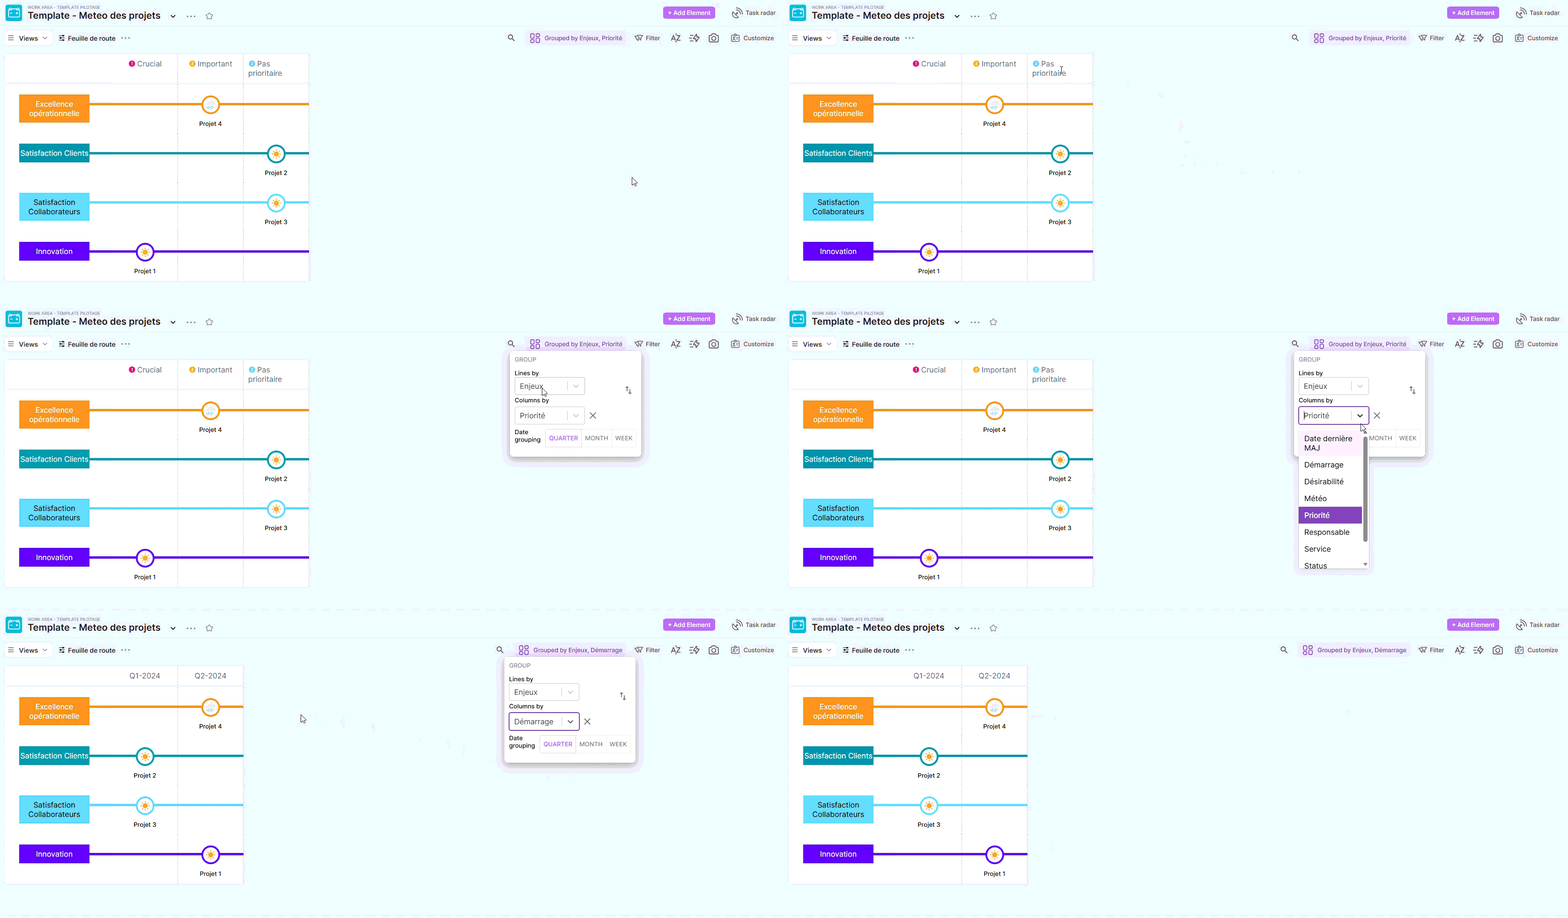
Roadmap (metro-lines)
Board Structure
You manage a list of projects, and each card/row corresponds to one project.
The idea: regularly update the vital minimum (weather + trend + progress), and fill in as you go (milestones, notes, budget, effort).
Properties (fields) of the template
Field
Type
What it's for
Example
Project
Text
Project name
Ready-to-use views
Portfolio 📚 (card view)
Quick management view: browse projects like a wall of suivi.
The cards highlight: status, progress, service and visual.
Very useful for a portfolio review or a short meeting.
Project list (table view)
The "management" view: perfect for quick editing (sorting, filtering, bulk updates).
Recommended when you update many fields at once (progress, status, weather…).
Response to Challenges (Card View)
Strategy-oriented view: reading by challenges to answer:
Very practical for preparing a steering committee / executive committee meeting.
Planning (planning view)
Chronological view based on:
Start date + Estimated duration
Key milestones (displayed as milestones)
Ideal for identifying overlaps, bottlenecks, and anticipating key checkpoints.
Roadmap (metro-lines view)
stakes
Sub-levels by priority
Weather badge to identify risk areas
roadmap with a broader audience.
How to Get Started (in 10 Minutes)
Add Your Projects
Create one card per project.
Fill in at minimum: Project, Manager, Department, Stakes.
Keep the steering dynamic
At each review (weekly or bi-weekly), update:
Weather (status at time T)
Trend (compared to the last review)
Progress (0–100%)
Status / Maturity
Frame the next steps
Add 3 to 7 key milestones maximum.
Set start date and estimated duration to populate the Schedule.
Best Practices (Highly Effective)
One golden rule: if the weather deteriorates, add 1 line in "Execution Notes" with:
the problem,
the impact,
the next action (and the person responsible).
Keep a factual Weather (health), and a comparative Trend (evolution).
Limit required fields to encourage usage: a template that's 60% complete but up-to-date is better than a perfect template that's been abandoned.