The Dashboard view is built from nested widgets on the page. They display data charts whose source can be:
- either the current board,
- or a web service.
To connect to data from a web service, the service must return a payload response in JSON format, with parameters that vary depending on the type of widget to be populated.
It is important to note that only certain widgets currently allow external data to be displayed, such as:
- Number,
- Curves,
- Bar chart,
- Donut chart,
- Radar,
- Histogram,
- Table.
Number Widget
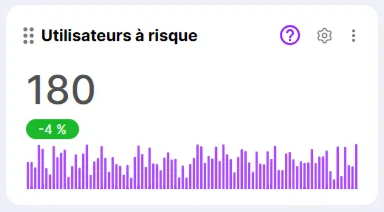
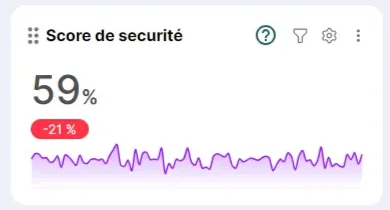
The Number widget allows you to display a score with its variation and potentially a value-by-date chart.
If multiple number widgets need to be displayed in the view, the payload response can contain all the information for each desired widget type. In this case, when configuring each widget, the settings will be configured so that it calls the correct information in the returned payload response.
Payload Response Format
Populating this type of widget requires the following information in the returned Payload response:
| Displayed Information | Attribute | Attribute Parameters | Required | Example |
|---|---|---|---|---|
| Widget title | title | "title":"Security Score", | ||
| Chart start date (date and time) | startDate | "startDate":"2024-12-20T00:00:00Z" | ||
| Chart end date (date and time) | endDate | "endDate":"2025-03-30T00:00:00Z" | ||
| Help button for accessing online documentation | help | text: Help label in tooltip URL: URL for accessing online help | "help":{"text":"Help here", "URL":"https://madocURL"}, | |
| Widget subtitle | subtitle | "subtitle":"Incidents this week", | ||
| URL targeted when clicking on the widget | onClickURL | "onClickURL":"http://example.com", | ||
| Alignment of information in the widget | align (default left) | "align":"left" | ||
| Number value | value | x and different from 0 | "value":"59" | |
| Number unit | unit | "unit":"%", | ||
| Image URL | imageUrl | |||
| Variation value badge with background color | variation | text: Variation badge value color: Badge background color in hex format | "variation":{"text":"-21 %", "color":"#06C350"}, | |
| Chart data | valueHistory | example 1: "valueHistory":{"dataset":[58, 25, 26, 87,25,120,25], "sparklineType":"line", "color":"#25542F" example 2: "valueHistory":{ "dataset":[ {"value": 50, "date": "2024-07-24T00:00:00Z"}, {"value": 60, "date": "2024-07-23T00:00:00Z"}, {"value": 30, "date": "2024-07-22T00:00:00Z"}, ], "sparklineType":"line"} |
Response Example
ANOTHER EXAMPLE
Curves Widget
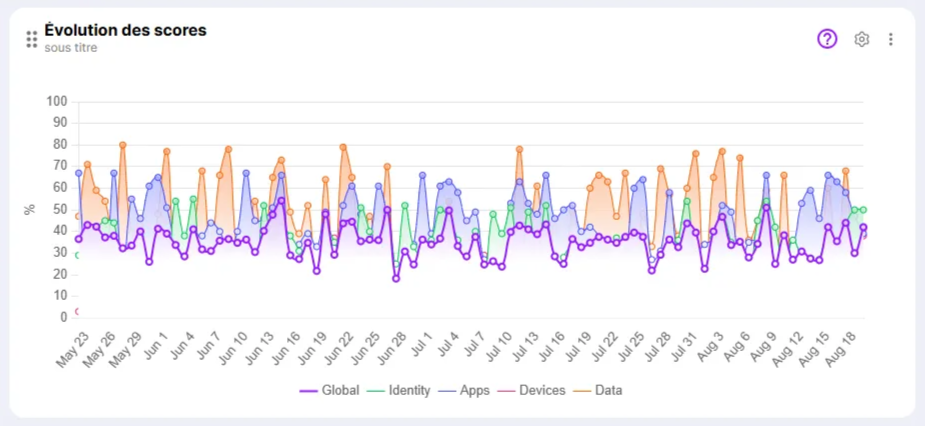
The Curves widget, as its name suggests, allows you to display data in the form of multiple curves.
{
"title":"Score de sécurité",
"startDate":"2024-12-20T00:00:00Z",
"endDate":"2025-03-30T00:00:00Z",
"help":{"text":"Aide ici",
"URL":"https://madocURL"},
"onClickURL":"http….",
"align": "left",
"value":"59",
"unit": "%",
"variation":{"text":"-21 %", "color":"#06C350"},
"valueHistory":{"dataset":[58, 25, 26, 87,25,120,25], "sparklineType":"line", "color": "#25542F"}
}
{
"title":"Utilisateurs à risque",
"help": {"text":"Aide ici", "URL":"https://madocURL "},
"subtitle":"Incidents cette semaine",
"onClickURL": "http….",
"value":"17",
"variation":{"text":"-38 %", "color":"green"},
"valueHistory":{"dataset": [
{"value": 50, "date":"2024-07-24T00:00:00Z"},
{"value": 60, "date": "2024-07-23T00:00:00Z"},
{"value": 30, "date": "2024-07-22T00:00:00Z"},
], "sparklineType":"line"}
}
Payload Response Format
Feeding this type of widget requires the following information in the returned Payload response:
| Displayed Information | Attribute | Attribute Parameters | Required | Example |
|---|---|---|---|---|
| Widget title | title | "title": "Score Evolution", | ||
| Help button to access online documentation | help | text: Help label in tooltip URL: URL to access online help | "help": { "text": "Help here", "URL": "https://example.com" }, | |
| Widget subtitle | subtitle | "subtitle": "Incidents this week", | ||
| Chart x-axis and y-axis type | scale | default {min: 0, max: 100} | "scale":{"min":10, "max":90} | |
| Visibility of points on the curve | hidePoints | False by default | "hidePoints": true | |
| URL targeted when clicking on the widget | onClickURL | "onClickURL": http://example.com, | ||
| Unit of chart values | unit | "unit": "%", | ||
| valueHeigtor | "valueHeigtor": "3", | |||
| Curve data | dataset | x | "dataset": [ { "name": "Dataset 1", hidden: true courbeLisse: number "lineColor": "#06C350", "lineWidth": "2", "values": [ { "value": 50, "date": "2024-07-24T00:00:00Z" }, { "value": 60, "date": "2024-07-23T00:00:00Z" }, { "value": 30, "date": "2024-07-22T00:00:00Z" } ] }, | |
| Chart type | chartType | can have multiple values such as line, progressBar, donuts, radar, verticalBar, ... but the one to use for this chart is obviously "line" | x | "charttype": "line" |
Response Example
Bar Chart Widget
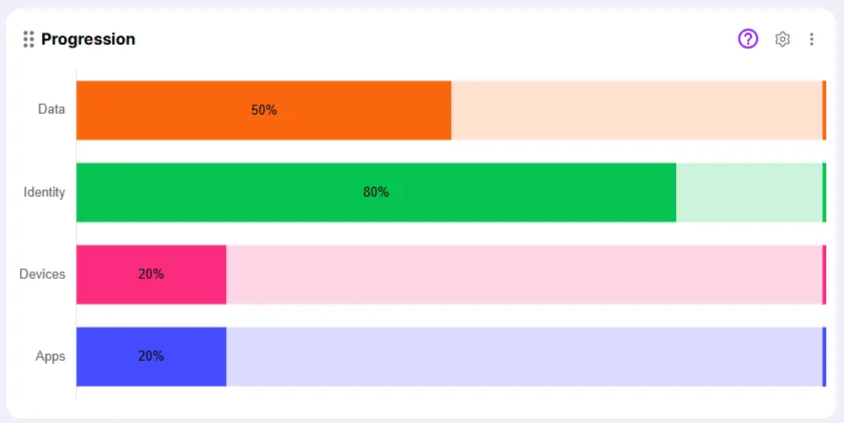
The Bar Chart widget allows you to display the progress of different indicators in the form of horizontal bars.
{
"title": "Évolution des scores",
"help": { "text": "Aide ici", "URL": "https://example.com" },
"subtitle": "sous titre",
"scale": {min : number , max: number } // par défaut { min : 0 , max : 100 }
"hidePoints": "true" // default true
"onclickURL": "http://example.com",
"unit": "%",
"valueHeigtor": "3",
"dataset": [
{"name": "Dataset 1", "hidden":"true", "courbeLisse" : "5"
"lineColor": "#06C350",
"lineWidth": "2",
"values": [
{ "value": 50, "date": "2024-07-24T00:00:00Z" },
{ "value": 60, "date": "2024-07-23T00:00:00Z" },
{ "value": 30, "date": "2024-07-22T00:00:00Z" }]},
{"name": "Dataset 2","lineColor": "#06C350","lineWidth": "1",
"values": [
{ "value": 40, "date": "2024-07-24T00:00:00Z" },
{ "value": 70, "date": "2024-07-23T00:00:00Z" },
{ "value": 20, "date": "2024-07-22T00:00:00Z" }]}],
"charttype": "line"
}
Payload Response Format
Populating this type of widget requires the following information in the returned Payload response:
| Displayed Information | Attribute | Attribute Parameters | Required | Example |
|---|---|---|---|---|
| Widget title | title | "title":"Score Evolution", | ||
| Help button to access online documentation | help | text: Help label in tooltip URL: URL to access online help | "help":{"text":"Help here", "URL":"https://example.com"}, | |
| Widget subtitle | subtitle | "subtitle":"subtitle", | ||
| Min and max scale of the chart's x-axis | scale | min: Min scale max: Max scale (default min: 0, max: 100) | "scale":{"min":0, "max":50} | |
| Chart with gradient on bars | isGradient | Default is False | "isGradient":true | |
| Horizontal axis display | hideScale | Default is False | "hideScale":true | |
| URL targeted when clicking on the widget | onClickURL | "onClickURL":"http://example.com", | ||
| Progress bar data | valueHistory | x isGradient must be true to enable gradientColor | "valueHistory":{"dataset":[ {"progress":50,"value":35,"barTitle":"Data","barColor":"#F9670D","textColor":"white","textPosition":"left","gradientColor":"#FFFFFF"}, {"progress":50, "value":122, "barTitle":"Identity", "barColor":"#06C350","textColor":"white","textPosition":"left","gradientColor":"#FFFFFF"}, {"progress":50, "value":122, "barTitle":"Endpoint", "barColor":"#06C350","textColor":"white","textPosition":"left","gradientColor":"#FFFFFF"} ]} | |
| Chart type | chartType | can have multiple values such as line, progressBar, donuts, radar, verticalBar, … but the one to use for this chart is obviously "progressBar" | x | "charttype":"progressBar" |
Response Example
Donut Chart Widget
{
"title":"Progression",
"help":{"text":"En savoir plus", "URL":"https://madocURL"},
"subtitle":"sous titre",
"scale":{"min":0, "max":50},
"isGradient":"true",
"hideScale":"true",
"onClickURL":"http://example.com",
"valueHistory":{"dataset":[
{"progress":50,"value":35,"barTitle":"Data","barColor":"#F9670D","textColor":"white","textPosition":"left","gradientColor":"#FFFFFF"},
{"progress":50,"value":122,"barTitle":"Identity","barColor":"#06C350","textColor":"white","textPosition":"left","gradientColor":"#FFFFFF"},
{"progress":50,"value":122,"barTitle":"Endpoint","barColor":"#06C350","textColor":"white","textPosition":"left","gradientColor":"#FFFFFF"}
]},
"chartType":"progressBar"
}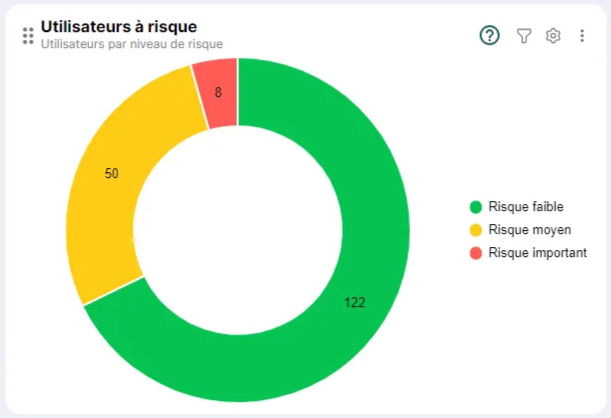
The Donut Chart widget, as its name suggests, allows you to represent data in the form of circular segments arranged around an empty center, thus forming a ring (or donut).
Payload Response Format
Populating this type of widget requires the following information in the returned Payload response:
| Displayed Information | Attribute | Attribute Parameters | Required | Example |
|---|---|---|---|---|
| Widget title | title | "title":"At-risk Users", | ||
| Help button providing access to online documentation | help | text: Help label in tooltip URL: URL to access online help | "help":{ "text":"Help here", "URL":"https://example.com"}, | |
| Widget subtitle | subtitle | "subtitle": "Incidents this week", | ||
| Data at the center of the ring (empty by default) | centerData | title: Label value: Value valueColor: Color of the value at the center of the ring | "centerData":{"title":"Title", "value":10, "valueColor":#F00020} | |
| URL targeted when clicking on a ring area | onClickURL | "onClickURL": http://example.com, | ||
| Chart data | values | x | "values": { "dataset": [ {"value": 122, "areaTitle": "Low", "areaColor": #06C350}, {"value": 50, "areaTitle": "Medium", "areaColor": #FBC02D}, {"value": 8, "areaTitle": "High", "areaColor": #D32F2F} ]} | |
| Chart type | chartType | can have multiple values such as line, progressBar, donuts, radar, verticalBar, … but the one to use for this chart is obviously "donuts" | x | "chartType": "donuts" |
Response Example
Radar Widget
{
"title":"Utilisateurs à risque",
"help":{"text":"Aide ici", "URL":"https://madocURL"},
"subtitle":"sous titre",
"onClickURL":"http://example.com",
"centerData":{"title":"Titre", "value":14}
"values": {"dataset":[
{"value":122,"areaTitle":"Faible","areaColor":"#06C350"},
{"value":50,"areaTitle":"Moyen","areaColor":"#FBC02D"},
{"value":8,"areaTitle": "Élevé","areaColor":"#D32F2F"}
]},
"chartType":"donuts"
}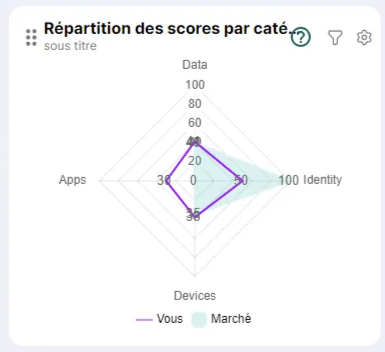
The Radar widget allows you to represent data in the form of an empty or filled star diagram. This makes it possible to display multiple datasets overlaid on top of each other.
Payload Response Format
Populating this type of widget requires the following information in the returned Payload response:
| Displayed Information | Attribute | Attribute Parameters | Required | Example |
|---|---|---|---|---|
| Widget title | title | "title" : "Score Distribution by Category", | ||
| Scale display | activateScale | true / false | "activateScale":true | |
| Scale value | scaleStep | 20 if the parameter is not specified, otherwise specify a numeric scale value. | activateScale must be set to true | "scaleStep":10 |
| Help button to access online documentation | help | text: Help label in tooltip URL: URL to access online help | "help" : { "text": "Help here", "URL" : "https://example.com" }, | |
| Widget subtitle | subtitle | "subtitle":"subtitle", | ||
| Min and max scale values | scale | min: min scale (0 by default) max: max scale (100 by default) | "scale":{"min":10, "max":90} | |
| Display of radar vertical axes | hideVerticalAxis | true / false | "hideVerticalAxis":"false" | |
| Display of radar value scales | hideHorizontalAxis | true / false | "hideHorizontalAxis":"true" | |
| Hide radar scale value (100) | hideScale | true / false | "hideScale":"true" | |
| URL pointed to when clicking on a ring area | onClickURL | "onClickURL":"http://example.com", | ||
| Chart data | values | x | "values":{"dataset" : [ {"name":"You","chartType":"line","chartColor":"#06C350", "values": [ {"value":50, "axis":"data" }, {"value":60, "axis":"identity" }, {"value":30, "axis":"endpoint" } ]}, {"name":"Market","chartType":"area","chartColor":"#FF6384", "values":[ {"value":40, "axis":"data"}, {"value":70, "axis":"identity"}, {"value":20, "axis":"endpoint"} ] }]}, | |
| Chart type | chartType | can have multiple values such as line, progressBar, donuts, radar, verticalBar, … but the one to use for this chart is obviously "radar" | x | "chartType" : "radar" |
Response Example
Histogram Widget
{
"title":"Répartition des scores par catégorie",
"help":{"text":"Aide ici", "URL":"https://madocURL"},
"subtitle":"sous titre",
"activateScale":"true",
"scaleStep":10 ,
"scale":{"min":10, "max":90},
"hideScale":"true",
"hideVerticalAxis":"true",
"onClickURL":"http://example.com",
"values":{"dataset" : [
{"name":"Dataset 1","chartType":"line","chartColor":"#06C350",
"values": [
{"value":50, "axis":"data" },
{"value":60, "axis":"identity" },
{"value":30, "axis":"endpoint" }
]
},
{"name":"Dataset 2","chartType":"area","chartColor":"#FF6384",
"values":[
{"value":40, "axis":"data"},
{"value":70, "axis":"identity"},
{"value":20, "axis":"endpoint"}
]
}
]
},
"chartType":"radar"
}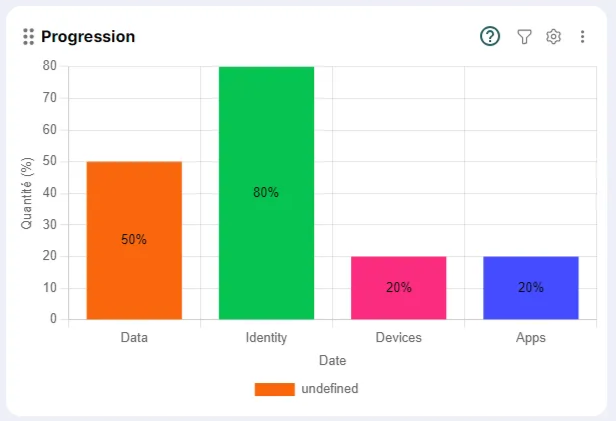
The Histogram widget, as its name suggests, allows you to represent data in the form of vertical bars.
Payload Response Format
Populating this type of widget requires the following information in the returned Payload response:
| Displayed Information | Attribute | Attribute Parameters | Required | Example |
|---|---|---|---|---|
| Widget title | title | "title":"Progress", | ||
| Help button to access online documentation | help | text: Help label in tooltip URL: URL to access online help | "help":{"text":"Help here", "URL": "https://example.com"}, | |
| Widget subtitle | subtitle | "subtitle":"Subtitle", | ||
| URL pointed to when clicking on a chart bar | onClickURL | "onClickURL":"http://example.com", | ||
| Chart data | valueHistory | dataset: Lists of history values - progress: Bar value - value: Number of values representing the bar - barTitle: Bar label - barColor: Bar color in hex format | x | "valueHistory":{"dataset":[ {"progress":50,"value":122,"barTitle":"Data","barColor":"#06C350"}, {"progress":50,"value":77,"barTitle":"Identity","barColor":"#06C355"}, {"progress":50,"value":98,"barTitle":"Endpoint","barColor":"#05C470"} ]}, |
| Chart type | chartType | can have multiple values such as line, progressBar, donuts, radar, verticalBar, ... but the one to use for this chart is obviously "verticalBar" | x | "chartType":"donuts" |
Response Example
Table Widget
{
"title":"Progression",
"help":{"text":"Aide ici", "URL":"https://madocURL"},
"subtitle":"sous titre",
"onClickURL":"http://example.com",
"valueHistory":{"dataset": [
{"progress":50,"value":122,"barTitle":"Data","barColor":"#06C350"},
{"progress":50,"value":77,"barTitle":"Identity","barColor":"#06C355"},
{"progress":50,"value":98,"barTitle":"Endpoint","barColor":"#05C470"}
]
},
"chartType": "verticalBar"
}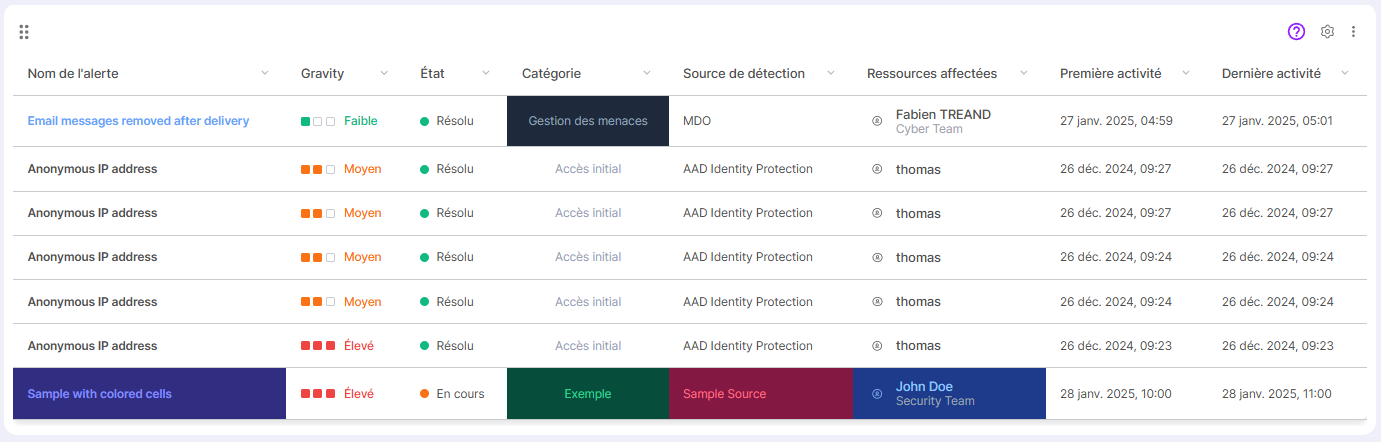
The Table widget allows you to present data in the form of a table that can contain simple data or data composed of a visual indicator and a label.
Payload Response Format
Populating this type of widget requires the following information in the returned Payload response:
| Displayed Information | Attribute | Attribute Parameters | Required | Example |
|---|---|---|---|---|
| Widget title | title | "title":"Threats", | ||
| Help button to access online documentation | help | text: Help label in tooltip URL: URL to access online help | "help":{"text":"Help here", "URL": "https://example.com"}, | |
| Widget subtitle | subtitle | |||
| URL targeted when clicking on a graph bar | onClickURL | "onClickURL":"http://example.com", | ||
| Description of table column configuration | columns | x | {"columns": [{ "id": "name", "label": "Alert Name", "type": "text", "sortable": true, "style": { "bold": true, "vborderColor":"red", "hborderColor":"transparent", }}, {"id": "severity", "label": "Gravity", "type": "rating", "sortable": true, "align": "center", "ratingMax": 3, "extraConfig": [ { "value": 1, "color": "#10b981", "label": "Low"}, { "value": 2, "color": "#f97316", "label": "Medium" }, { "value": 3, "color": "#ef4444", "label": "High"} ]}, {"id": "status", "label": "Status", "type": "status", "sortable": true, "align": "center", "extraConfig": [ { "id": "resolved", "label": "Resolved", "color": "#10b981" }, { "id": "in-progress", "label": "In Progress", "color": "#f97316" }, { "id": "open", "label": "Open", "color": "#3b82f6" }, { "id": "default", "label": "Not Defined", "color": "#6b7280" } ]}, {"id": "category", "label": "Category", "type": "category", "sortable": true, "align": "center", "style": { "color": "#94a3b8" }}, {"id": "source", "label": "Detection Source", "type": "text", "sortable": true }, {"id": "resources", "label": "Affected Resources", "type": "user", "sortable": true }, {"id": "firstActivity", "label": "First Activity", "type": "date", "sortable": true }, {"id": "lastActivity", "label": "Last Activity", "type": "date", "sortable": true }], | |
| Table data | data | data: List of table data Each column id and the value to be displayed are then listed. Indeed, each block constitutes a row in the table. If a column offers rendering options, then the values related to these different rendering parameters will also be specified (e.g.: color, background, etc). | x | "data": [ {"name": "Email messages removed after delivery", "severity": 1, "status": "resolved", "category": "Threat Management", "source": "MDO", "resources": { "name": "Fabien TREAND", "role": "Cyber Team" }, "firstActivity": "2025-01-27T04:59:00", "lastActivity": "2025-01-27T05:01:00", "_style": { "name": { "color": "#60a5fa" }, "category": { "background": "#1e293b" }}}, {"name": "Anonymous IP address", "severity": 2, "status": "resolved", "category": "Initial Access", "source": "AAD Identity Protection", "resources": { "name": "thomas" }, "firstActivity": "2024-12-26T09:27:00", "lastActivity": "2024-12-26T09:27:00" }, {"name": "Anonymous IP address", "severity": 2, "status": "resolved", "category": "Initial Access", "source": "AAD Identity Protection", "resources": { "name": "thomas" }, "firstActivity": "2024-12-26T09:27:00", "lastActivity": "2024-12-26T09:27:00" }, {"name": "Anonymous IP address", "severity": 2, "status": "resolved", "category": "Initial Access", "source": "AAD Identity Protection", "resources": { "name": "thomas" }, "firstActivity": "2024-12-26T09:24:00", "lastActivity": "2024-12-26T09:24:00" }, {"name": "Anonymous IP address", "severity": 2, "status": "resolved", "category": "Initial Access", "source": "AAD Identity Protection", "resources": { "name": "thomas" }, "firstActivity": "2024-12-26T09:24:00", "lastActivity": "2024-12-26T09:24:00" }, {"name": "Anonymous IP address", "severity": 3, "status": "resolved", "category": "Initial Access", "source": "AAD Identity Protection", "resources": { "name": "thomas" }, "firstActivity": "2024-12-26T09:23:00", "lastActivity": "2024-12-26T09:23:00" }, {"name": "Sample with colored cells", "severity": 3, "status": "in-progress", "category": "Example", "source": "Sample Source", "resources": { "name": "John Doe", "role": "Security Team" }, "firstActivity": "2025-01-28T10:00:00", "lastActivity": "2025-01-28T11:00:00", "_style": { "name": { "background": "#312e81", "color": "#818cf8", "bold": true }, "category": { "background": "#064e3b", "color": "#34d399" }, "source": { "background": "#831843", "color": "#fb7185" }, "resources": { "background": "#1e3a8a", "color": "#93c5fd" }}}]} |
Response Example
Setting Up a Widget Connected to an External Data Source
Connecting to External Data
To connect to external data, you need to declare the source as follows:
{
  "columns": [
    {
      "id": "name",
      "label": "Nom de l'alerte",
      "type": "text",
      "sortable": true,
      "style": {
        "bold": true
      }
    },
    {
      "id": "severity",
      "label": "Gravity",
      "type": "rating",
      "sortable":"true",
      "align": "center",
      "ratingMax": 3,
      "extraConfig": [
        { "value": 1, "color": "#10b981", "label": "Faible" },
        { "value": 2, "color": "#f97316", "label": "Moyen" },
        { "value": 3, "color": "#ef4444", "label": "Élevé" }
      ]
    },
    {
      "id": "status",
      "label": "État",
      "type": "status",
      "sortable":"true",
      "align": "center",
      "extraConfig": [
        { "id": "resolved", "label": "Résolu", "color": "#10b981" },
        { "id": "in-progress", "label": "En cours", "color": "#f97316" },
        { "id": "open", "label": "Ouvert", "color": "#3b82f6" },
        { "id": "default", "label": "Non défini", "color": "#6b7280" }
      ]
    },
    {
      "id": "category",
      "label": "Catégorie",
      "type": "category",
      "sortable":"true",
      "align": "center",
      "style": {
        "color": "#94a3b8",
				"vborderColor":"red",
				"hborderColor":"transparent",
      }
    },
    {
      "id": "source",
      "label": "Source de détection",
      "type": "text",
      "sortable":"true"
    },
    {
      "id": "resources",
      "label": "Ressources affectées",
      "type": "user",
      "sortable":"true"
    },
    {
      "id": "firstActivity",
      "label": "Première activité",
      "type": "date",
      "sortable":"true"
    },
    {
      "id": "lastActivity",
      "label": "Dernière activité",
      "type": "date",
      "sortable":"true"
    }
  ],
  "data": [
    {
      "name": "Email messages removed after delivery",
      "severity": 1,
      "status": "resolved",
      "category": "Gestion des menaces",
      "source": "MDO",
      "resources": {
        "name": "Fabien TREAND",
        "role": "Cyber Team"
      },
      "firstActivity": "2025-01-27T04:59:00",
      "lastActivity": "2025-01-27T05:01:00",
      "_style": {
        "name": {
          "color": "#60a5fa"
        },
        "category": {
          "background": "#1e293b"
        }
      }
    },
    {
      "name": "Anonymous IP address",
      "severity": 2,
      "status": "resolved",
      "category": "Accès initial",
      "source": "AAD Identity Protection",
      "resources": {
        "name": "thomas"
      },
      "firstActivity": "2024-12-26T09:27:00",
      "lastActivity": "2024-12-26T09:27:00"
    },
    {
      "name": "Anonymous IP address",
      "severity": 2,
      "status": "resolved",
      "category": "Accès initial",
      "source": "AAD Identity Protection",
      "resources": {
        "name": "thomas"
      },
      "firstActivity": "2024-12-26T09:24:00",
      "lastActivity": "2024-12-26T09:24:00"
    },
    {
      "name": "Anonymous IP address",
      "severity": 3,
      "status": "resolved",
      "category": "Accès initial",
      "source": "AAD Identity Protection",
      "resources": {
        "name": "thomas"
      },
      "firstActivity": "2024-12-26T09:23:00",
      "lastActivity": "2024-12-26T09:23:00"
    },
    {
      "name": "Sample with colored cells",
      "severity": 3,
      "status": "in-progress",
      "category": "Exemple",
      "source": "Sample Source",
      "resources": {
        "name": "John Doe",
        "role": "Security Team"
      },
      "firstActivity": "2025-01-28T10:00:00",
      "lastActivity": "2025-01-28T11:00:00",
      "_style": {
        "name": {
          "background": "#312e81",
          "color": "#818cf8",
          "bold":"true"
        },
        "category": {
          "background": "#064e3b",
          "color": "#34d399"
        },
        "source": {
          "background": "#831843",
          "color": "#fb7185"
        },
        "resources": {
          "background": "#1e3a8a",
          "color": "#93c5fd"
        }
      }
    }
  ]
}- Click the … button on the board > Connectors.
- Click on New connection > Dashboard data source.
- Enter the required information including the URL to access the targeted web service.
- Click on Add.
Once the connection is established, you must then use this connection when adding your widgets in the Dashboard view.
Declaring variables
In the board, you may need to declare one or more variables that will allow you to contextualize the Dashboard view to a specific data scope (e.g., a client's data). To do this, you can declare a variable that you will then call on the desired widget(s), with these variables being interpreted when the view loads.
- Click the … button on the board > Connectors.
- Click the Variables tab.
- Click New Variable.
- Enter its name and value before validating.
- Edit the widget settings that will use this variable by clicking on the widget's Gear button.
- In the Payload tab, enter the value as: "Variable data name": "%Name of the variable declared in the board%"
Adding a Connected Widget in the Dashboard View
Adding a connected widget is very simple:
- In the Dashboard view, click Add a widget.
- Select a widget from those compatible with an external source.
- Choose the connection corresponding to the previously declared source.
- Enter the payload parameters specific to your web service.
- Click Save.
Note: you can click Test then on the Test Results tab to check if your Payload settings are properly configured and return the expected information.
Test / Temporarily Modify Data Returned in Dashboard View
As mentioned previously, by clicking Test, you can access the data returned in the widget's payload response on the Test Results tab.
However, note that you can also modify this data and click Apply to see the changes temporarily applied in the view's widget.